Brand Measurement, CFOs, and What to Track Instead
Stakes & Outcome: What’s at Risk?
Stakes
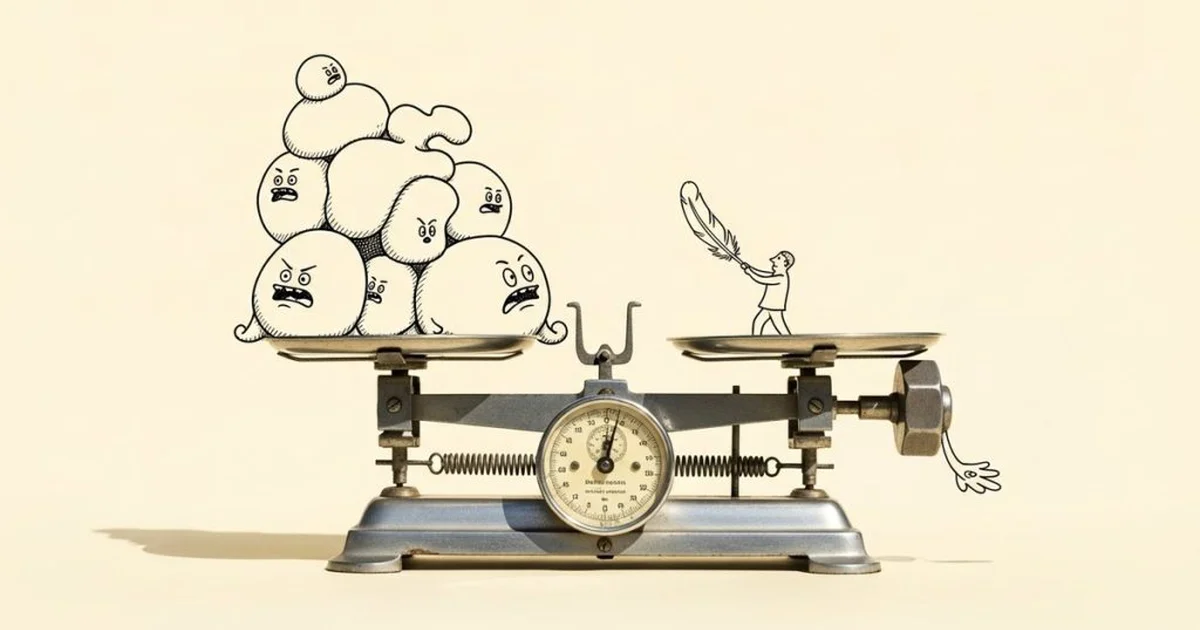
Brand budgets are on the chopping block. In 2025, only 22% of marketers prioritized brand, while 55% shifted to performance (MarTech, 2025). CFOs are not anti-brand—they’re anti-vague. If you can’t tie brand spend to pipeline, CAC payback, or margin, your budget will be reallocated to channels with a clearer path to revenue.
Outcome
The goal is not to defend brand, but to make it investable. That means translating brand impact into metrics the CFO already uses:
- Pipeline lift (qualified opportunities, not impressions)
- CAC payback (months to recover spend)
- Gross margin (does brand lower discounting or churn?)
- NRR (does brand drive expansion/retention?)
If you can’t show the math, you won’t get the money.
Model/Framework: How to Think Like a CFO
Assumptions
- CFOs fund outcomes, not activities.
- Attribution is imperfect, but unmeasurable ≠ unimportant.
- Brand is a lever—if it doesn’t move pipeline, it’s a cost center.
The CFO-Grade Brand Model
- Revenue Linkage: Tie brand activity to pipeline creation (e.g., branded search → inbound demo requests → qualified pipeline).
- Hard KPIs: Use metrics with a direct line to revenue:
- Share of search (as a leading indicator)
- Direct traffic lift
- Branded inbound leads
- Win rate vs. unbranded leads
- Benchmarks: Compare to industry and competitor norms (e.g., share of search, unaided awareness in target segment).
- Payback Math: Model CAC payback:
- Formula: CAC Payback = Brand Spend / (Gross Margin per New Customer × Conversion Rate from Brand Channel)
- If payback > 12 months, CFO will cut or reallocate.
Sensitivity Table Example
| Assumption | Base Case | Downside | Upside |
|---|---|---|---|
| Branded search lift | +20% | +10% | +30% |
| Demo-to-pipeline rate | 40% | 30% | 50% |
| Pipeline-to-win rate | 25% | 15% | 35% |
| CAC payback (months) | 9 | 14 | 6 |
Data & Benchmarks: What’s Normal? What’s Exceptional?
What Fails
- Soft metrics: Awareness, impressions, brand equity with no tie to pipeline.
- Last-click bias: Over-credits performance, under-credits brand’s role in demand creation.
- ROAS as a proxy: Digital attribution captures only 18% of long-term impact (Gain Theory, 2025).
What Works
- Share of Search: Correlates with future market share. A 10% increase in branded search volume typically yields a 3–5% lift in inbound pipeline within 1–2 quarters (Wynter, 2025).
- Branded Inbound Conversion: Branded leads convert 2–3x higher than non-branded. Example: If branded demo requests convert at 30% vs. 12% for generic, model incremental pipeline from brand lift.
- CAC Payback: Brand-driven pipeline often lowers CAC by 15–25% due to higher intent and lower discounting (Wynter, 2025).
- Gross Margin Impact: Strong brands command 5–10% higher price premiums, improving gross margin (Yahoo Finance, 2025).
- NRR/Upsell: Brand trust increases expansion rates by 8–12% in SaaS (Taylor & Francis, 2025).
Pilot Plan: 2–3 Week Implementation
Objective
Prove brand’s impact on pipeline and CAC payback in 3 weeks—enough for a board update.
Why Brand Measurement Fails CFOs (and What to Track Instead)
Step 1: Baseline Measurement (Days 1–3)
- Pull last 12 months of branded vs. non-branded inbound data.
- Calculate conversion rates, CAC, and payback by source.
Step 2: Brand Activation (Days 4–10)
- Launch a targeted brand campaign (e.g., LinkedIn + industry podcasts) in one region or segment.
- Track branded search, direct traffic, and inbound demo requests daily.
Step 3: Attribution & Sensitivity (Days 11–17)
- Use share of search and direct traffic as leading indicators.
- Model pipeline lift:
- If branded search increases by 15%, what’s the incremental pipeline?
- Track demo-to-pipeline and pipeline-to-win rates for branded leads.
Step 4: Board-Grade Reporting (Days 18–21)
- Build a sensitivity table: show base, downside, and upside scenarios.
- Calculate CAC payback for incremental pipeline.
- Prepare a one-pager: Brand campaign in [segment] drove X% lift in branded search, Y% lift in pipeline, CAC payback improved by Z months.
Success Metric
- Minimum 10% lift in branded pipeline
- CAC payback < 12 months
- Gross margin improvement > 2%
Risks & Mitigations
Risk Table
| Risk | Mitigation |
|---|---|
| Attribution noise | Use holdout regions/segments as control |
| Lag between brand spend and impact | Set expectations: initial lift in 2–4 weeks, full impact in 2–4 quarters |
| Data gaps | Use proxy metrics (share of search, direct traffic) and triangulate with CRM data |
| Overstating impact | Show sensitivity ranges, not just best case |
| Board skepticism | Lead with internal data, benchmark against competitors, show payback math up front |
Bottom Line
If you want CFO support, stop selling “brand value” and start selling pipeline, payback, and margin.
- Kill vanity metrics.
- Model every assumption.
- Run a 3-week pilot with a clear success metric.
- If CAC payback doesn’t improve, reallocate.
- If it does, scale with confidence—and bring the CFO the math, not the mood.
Board-grade means assumptions up front and a sensitivity table on page one. If Finance won’t sign it, it doesn’t exist.
References
- MarTech, 2025: CFOs want hard numbers, not brand vibes
- Wynter, 2025: Selling brand marketing budgets to the CFO: proof, not promises
- Standout Consulting, 2025: Your CFO Isn’t Killing Your Brand Budget, Your Language Is
Model or it didn’t happen. Run the numbers. Get the budget. Move the needle.