
Stakes & Outcome: Why Pipeline Velocity Is Boardroom Oxygen
What’s at risk: If you can’t answer “How much revenue will we close, and how soon?” with math, you’re not running a revenue engine—you’re running a hope machine. Boards don’t fund hope. They fund predictability. Miss pipeline velocity targets, and you’ll miss revenue, burn cash, and lose CFO trust. Hit them, and you get budget, headcount, and a seat at the table.
Specific outcome: Boards want a single number: “How fast are qualified dollars moving from pipeline to closed-won?” If you can’t show acceleration (or spot friction) in real time, you’re flying blind. Pipeline velocity is the only metric that ties marketing, sales, and finance to the same forecast.
Model/Framework: Pipeline Velocity—Plain English, Board-Grade Math
The model: Pipeline velocity quantifies how quickly qualified opportunities convert to revenue. It’s not a vanity metric. It’s a compounded, leading indicator that bakes in both quality and speed.
Pipeline Velocity Is the Metric Boards Actually Care About
Formula:
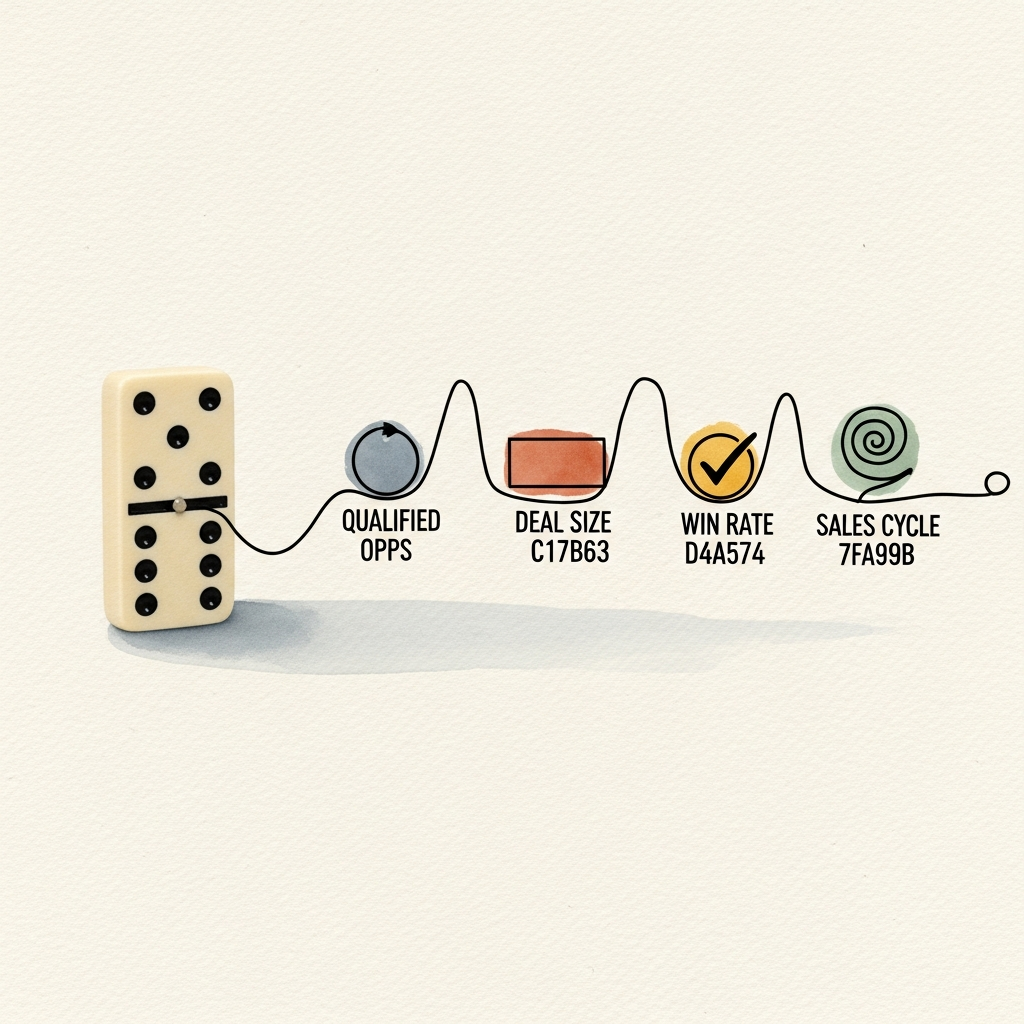
Pipeline Velocity = (Number of Qualified Opportunities × Average Deal Size × Win Rate) ÷ Average Sales Cycle Length
Example
- 50 qualified opps
- $40,000 average deal size
- 25% win rate
- 60-day average sales cycle
Pipeline Velocity = (50 × $40,000 × 0.25) ÷ 60 = $500,000 / 60 = $8,333/day
That’s $8,333 of pipeline converting to revenue per day. If your board wants $5M in new ARR this quarter, you need to show how your pipeline velocity gets you there—on time.
Assumptions
- “Qualified” means sales-accepted, not just MQLs.
- Win rate is trailing 90 days, not wishful thinking.
- Sales cycle is measured from opp creation to close, not from first touch.
Sensitivity Table
| Input | Baseline | +10% Impact | -10% Impact |
|---|---|---|---|
| Qualified Opps | 50 | $9,166/day | $7,500/day |
| Deal Size | $40,000 | $9,166/day | $7,500/day |
| Win Rate | 25% | $9,166/day | $7,500/day |
| Sales Cycle (days) | 60 | $7,575/day | $9,259/day |
Key insight: Pipeline velocity is most sensitive to win rate and sales cycle. Improving win rate by 10% moves the needle as much as adding 10% more opps. Cutting sales cycle by 10% is a direct lever for acceleration.
Data & Benchmarks: What’s Normal, What’s Exceptional
2026 SaaS Benchmarks (B2B, $30k–$100k ACV)
- Qualified Opps per quarter: 40–80
- Average Deal Size: $35k–$90k
- Win Rate: 18–28% (top quartile: 30%+)
- Sales Cycle: 60–120 days (top quartile: <75 days)
- Healthy Pipeline Velocity: $5,000–$12,000/day (for $5M–$10M quarterly targets)
What boards are seeing
- High velocity: Deals move, forecast is reliable, revenue lands on time.
- Low velocity: Deals stall, pipeline bloats, forecast slips, CFO confidence erodes.
What’s not board-grade
- MQL counts (vanity, not predictive)
- Pipeline size without movement (pipeline “pollution”)
- Win rates based on unqualified opps
Pilot Plan: 2–3 Week Implementation
Objective
Quantify, baseline, and accelerate pipeline velocity in 15 business days.
Step 1: Audit & Baseline (Days 1–3)
- Pull last 90 days of pipeline data (qualified opps only)
- Calculate current pipeline velocity using the formula above
- Identify bottlenecks: stage duration, win rate by segment, deal size outliers
Step 2: Quick Wins (Days 4–10)
- Kill or requalify stalled opps >2x average sales cycle (remove “pipeline pollution”)
- Tighten qualification criteria (align with sales, not just marketing)
- Run a “deal acceleration” sprint:
- Prioritize opps within 20% of close
- Assign exec sponsor to unblock
- Track stage movement daily
Step 3: Experiment (Days 11–15)
- Test one friction-reduction lever (e.g., streamline legal, automate follow-ups, pre-empt objections)
- Measure impact on stage progression and cycle time
- Re-calculate pipeline velocity at end of week
Success metric
+10% improvement in pipeline velocity or 10% reduction in sales cycle within 15 days
Risks & Mitigations
| Risk | Mitigation |
|---|---|
| Inflated opp counts (false velocity) | Use sales-accepted opps only; audit CRM weekly |
| Win rate distortion | Exclude opps <30 days old; use rolling 90-day |
| Sales cycle gaming | Track from opp creation, not first meeting |
| Pipeline “pollution” | Purge stalled opps >2x cycle; enforce exit criteria |
| Over-rotation to velocity | Monitor deal quality and NRR post-close |
Board-grade caveat: Velocity without quality = churn tomorrow. Quality without velocity = missed targets today. You need both.

Pipeline Velocity Is the Metric Boards Actually Care About
Bottom Line
Pipeline velocity is the only metric that lets you forecast, allocate, and defend budget with CFOs and boards. If you can’t show how fast qualified dollars are moving, you’re not running a revenue engine—you’re running a spreadsheet museum. Model it, baseline it, and run a 2-week pilot. If velocity doesn’t improve, kill the experiment and reallocate. No sunk cost fallacy. No buzzwords. Just math, movement, and money.
Take this to your CFO tomorrow. If they won’t sign it, call me.